Member-only story
Grafana Alerting vs AlertManager: A Comparison of Two Leading Monitoring Tools
- Introduction
- What are the main capabilities Grafana Alerting provides today?
- Grafana Alerting vs Prometheus Alert Manager
- Summary
Introduction
Grafana Alerting capabilities continue to improve in each new release the GrafanaLabs team does. Especially with the changes done in Grafana 8 and Grafana 9, many questions have been raised regarding its usage, the capabilities supported, and the comparison with other alternatives.
We want to start setting the context about Grafana Alerting based on the usual stack we deployed to improve the observability of our workloads. Grafana can be used for any workload; there is a preference for some specific ones being the most used solution when we talk about Kubernetes workloads.
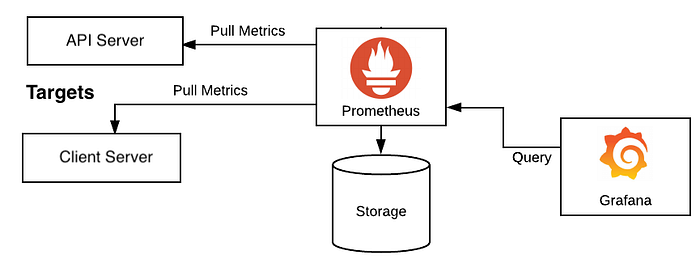
In this kind of deployment, the stack we usually deploy is Grafana as the visualization tool and Prometheus as the core to gather all metrics, so all responsibilities are differentiated. Grafana draws all the information using its excellent dashboarding capabilities, gathering the information from Prometheus.

When we plan to start including alerts, as we cannot accept that we need to have a specific team just watching dashboards to detect where something is going wrong, we need to implement a way to push alerts.
Alerting capabilities in Grafana have been present since the beginning, but its capabilities in the early stages have been limited to generating graphical alerts focused on the dashboards. Instead of that, Prometheus acting as the brain, includes a side-card component called AlertManager that can handle the creation and notification of any alerts generated from all the information stored in Prometheus.
As main capabilities that Alert Manager provides are the definition of the alerts, a grouping of the alerts, dismiss rules to mute some notifications, and finally, the way to send that alert to any system based on a plugin system and a webhook to be able to extend it to any…
